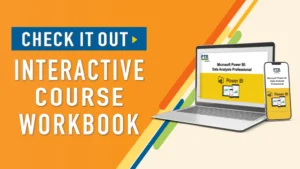
Microsoft Power BI: Data Analysis for Practitioners

Course Overview
Microsoft Power BI was built to connect to a wide range of data sources. It lets users quickly visualize connected data to gain insights, show trends, and create reports. Power BI’s data connection capabilities and visualization features go far beyond those in spreadsheets. In this 2-day course, you will learn to create compelling and interactive worksheets, dashboards, and stories that bring data to life and turn data into thoughtful action.
Learning Objectives
- Analyze data and create reports with Power BI.
- Connect to data.
- Clean, transform, and load data.
- Visualize data with Power BI.
- Enhance visuals to support data analysis.
- Customize and filter reports.
- Sharing reports and creating Power BI dashboards.
Who It's For
- Data analysts and business intelligence practitioners who want to improve their reporting and visualization skills.
- Business professionals who work with data and need to turn information into actionable insights.
- Managers and decision-makers who use reports and dashboards to monitor trends and performance.
- Microsoft Excel users looking to expand their data analysis capabilities with Power BI.
- Professionals responsible for creating, customizing, and sharing interactive business reports.
Course Agenda
Seven modules · 19 topics1Analyzing Data & ReportingTopics 1–2
2Connecting to DataTopics 3–5
3Cleaning, Transforming, & Loading Data Topics 6–9
4Visualizing Data with Power BITopics 10–11
5Enhancing Visuals for Data AnalysisTopics 12–13
6Customizing & Filtering ReportsTopics 14–16
7Sharing Reports & Creating DashboardsTopics 17–19
About our Trainers



Our Mission
Our facilitators are committed to delivering the latest industry trends, job-specific best practices, and the essential soft and hard skills needed in today’s workforce. PTR offers small and large organizations the choice between onsite and virtual training. Collaborate with our specialists to address challenges, bridge skill gaps, and tailor the learning experience to meet your company’s goals.
This two-day training course teaches participants how to use Microsoft Power BI to connect to data sources, clean and transform data, create visualizations, customize reports, and build interactive dashboards. It focuses on turning business data into meaningful insights and reports. You will learn how to connect to data sources, manage data relationships, clean and transform data, create visualizations, customize reports, apply filters, and build and share Power BI dashboards. Microsoft Power BI is a business intelligence tool used to connect to data sources, analyze information, visualize trends, and create interactive reports and dashboards. It helps users understand data and communicate insights to support business decisions. Power BI includes the Query Editor, which helps users load, clean, shape, profile, and transform data before analysis. This course covers working with the Query Editor to prepare data for reporting and visualization. Yes. Participants learn how to create visualizations in Power BI and select appropriate visualization types. The course also covers customizing visuals and pages and incorporating tooltips to support data analysis. Yes. Power BI supports interactive reports and dashboards. This course covers report customization, filtering, slicers, dashboard creation, and adding Q&A functionality to Power BI dashboards. Slicers are interactive filtering controls that allow report users to narrow down the data displayed in visualizations. The course covers configuring slicers to make reports more interactive and easier to explore. Power BI offers dedicated business intelligence capabilities, including connections to multiple data sources, interactive visualizations, report filtering, and dashboards. Excel is also useful for spreadsheet-based analysis. The course highlights Power BI’s data connection and visualization capabilities beyond those commonly available in spreadsheets.Frequently Asked Questions
What is the Microsoft Power BI: Data Analysis for Practitioners course?
What will I learn in this Microsoft Power BI training?
What is Microsoft Power BI used for in data analysis?
How do I clean and transform data in Power BI?
Does the Power BI course cover data visualization?
Can I create interactive reports and dashboards with Power BI?
What are slicers in Power BI, and how are they used?
Is Microsoft Power BI better than Excel for data visualization?
Related Courses
Discover More Ways to Build Your Skills



Microsoft Power BI: Data Analysis for Practitioners
Request a Training Quote
Share your team’s goals, and we’ll recommend the right skills training.